A picture is a poem without words.
By Horace
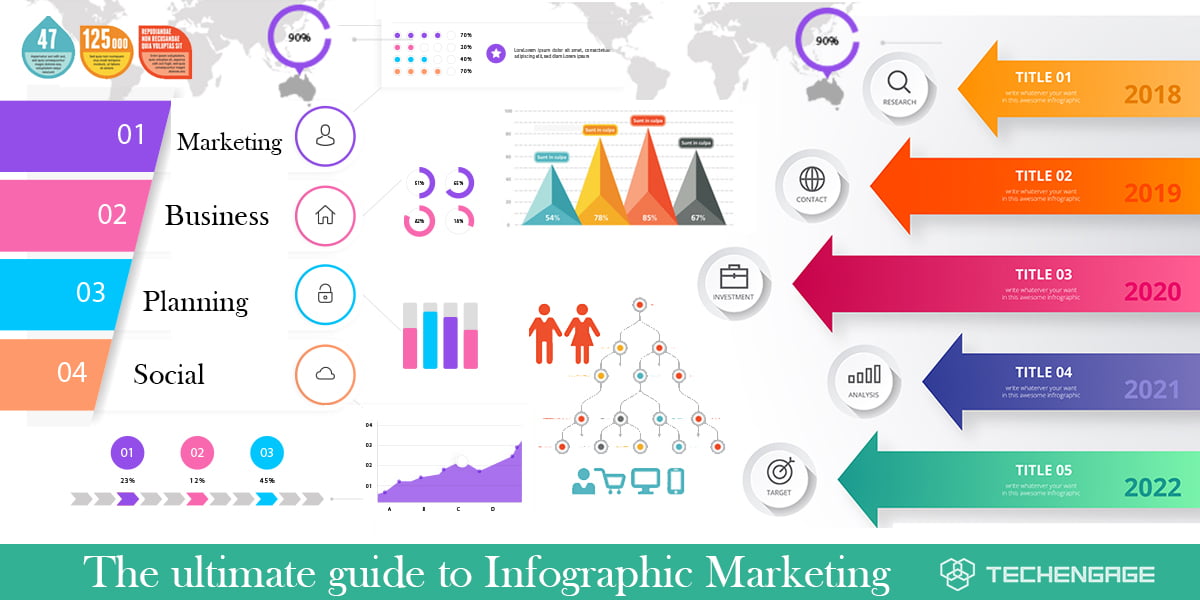
In the heart of content marketing, there has been an increased amount of businesses and people using visual content, and that content relies on infographics. Infographics, amongst other content marketing, is becoming the most popular trend of visual content. As people read and view infographics, whether on social media platforms, web pages, stock images, videos, quotes, advertisements, and many more.
The term ‘infographic’ is divided into two words: information and graphics, which means presenting information, data, or knowledge visually.
The Purpose of Infographics
Infographics are created or designed for many purposes, from website traffic to sharing posts between friends and families. Infographics are a part of visual communication as the information is viewed easily without explaining what the image represents through words.
Charts and graphs are also an important part of infographics as they explain the trend of the data to pass the message to the audience. However, not all charts and graphs are interpreted easily as some of these visuals are only targeted for a certain purpose. For example, in the education sector, pie charts can identify why a parent wants their child to get admission to that certain school and the reasons being reasonable fee structure, the standard of delivering the education, or excellent facilities. Scatter graphs are used to interpret the data that links two things: the relationship between the number of people smoking and the number of people getting lung cancer.
Charts and graphs speak for both presentation and exploration as they visualize the story behind what the data indicates. Infographics can be used to present and explore what the data or information is being conveyed to the audience. This is the main purpose of using infographics in firms.
Advantages of Infographics
Infographics have several advantages which are mentioned below:
- Easy to understand – infographics are easy to understand as the information is interpreted easily.
- Minimal words – the paragraphs are translated into graphical content with limited phrases that can be easier to explain.
- Eye-catching – infographics tend to be very eye-catching, which appeals to the viewers or readers
- Easy to share – infographics can be shared easily without acknowledging who created the design or worrying about copyright issues.
Disadvantages of Infographics
Infographics do have certain pitfalls which are mentioned as follows:
- Time-consuming – infographics are not done without the use of research as the design and layout has to be planned out carefully to avoid misleading information
- Not quite enough – they don’t always give you the full story as they lack lengthy words and paragraphs, and there isn’t enough room for the words to be put into.
- Hard to read – infographics can be hard to read if the space of the information is crammed too much with images and phrases
Depending on the amount of information and the size of the images used, infographics definitely have benefits and pitfalls that need to be considered before creating one. Whether you are sharing posts or designing infographics for business purposes, infographics are used not only to interpret results but also to display a story. A story that can be revealed behind the data allows the audience to explore the content behind it.
Studies have shown according to BuzzSumo shows that articles of 75 – 100 words with an image got twice the number of shares compared to an article without the images.
To conclude, infographics has played an important role in visual content marketing. Visual content is not something new; it has been used for quite a long time. Infographics are not always a hundred percent reliable.
However, infographics should be used in the right context and target the right audience to boost engagement on the web page and any social media platform. Infographics have to be included as without any form of visual content, it would have been dull and boring for the audience. The creativity of infographics never ends!
So indulge your site with infographics for better website traffic!


